Edit chart
Loading graph
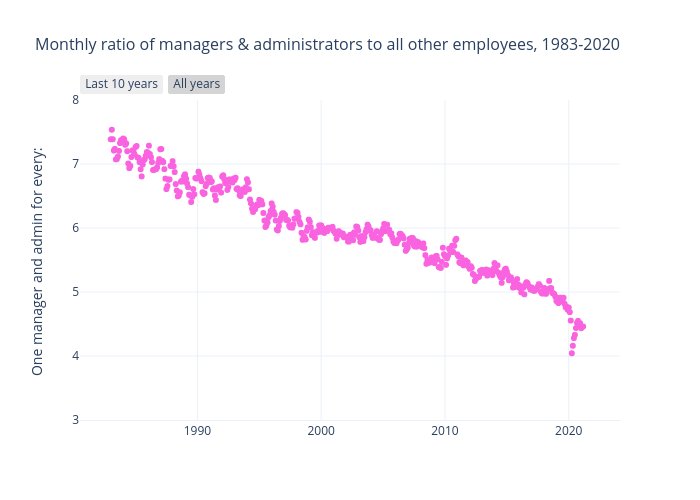
Michelezanini's interactive graph and data of "Monthly ratio of managers & administrators to all other employees, 1983-2020" is a scatter chart, showing ; with in the x-axis and One manager and admin for every: in the y-axis.. The x-axis shows values from 1980-08-19 01:27:06.5669 to 2023-07-13 22:32:53.4331. The y-axis shows values from 3 to 8. This visualization has the following annotations: Managers & support staff; All other